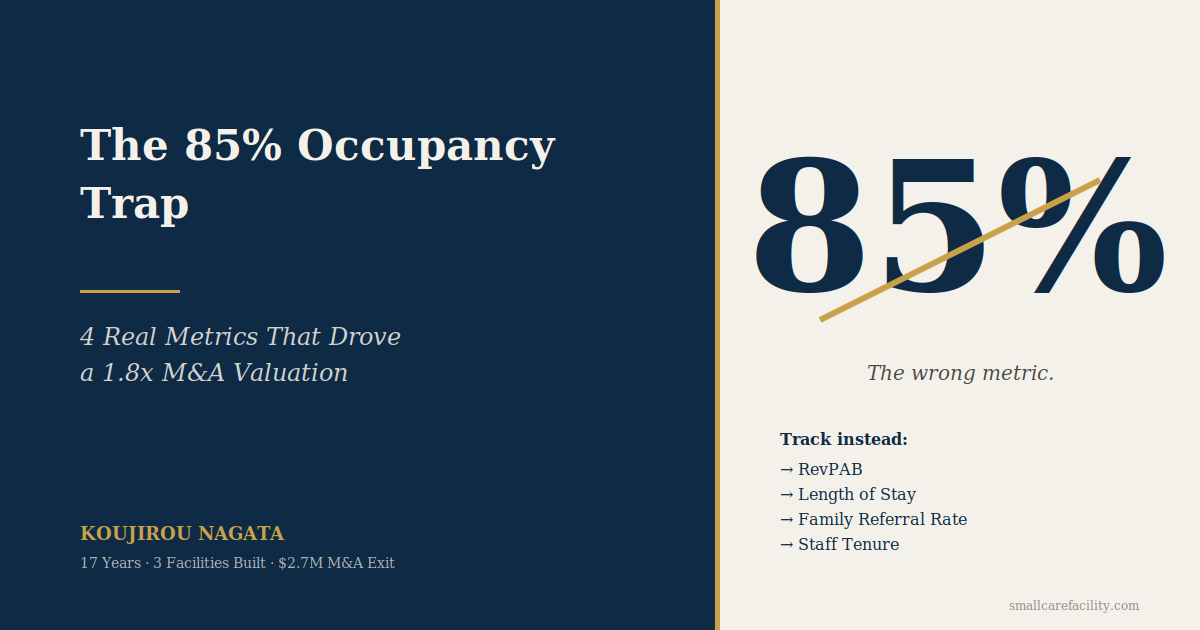
In U.S. assisted living, 85% occupancy is treated as the metric of operational health. That framing is half right and half catastrophically wrong.
During my 2022 M&A exit ($2.7M), the buyer barely examined occupancy. The four metrics they actually scrutinized are what produced a valuation roughly 1.8x above the small-scale benchmark.
Why 85% Is the Wrong Target
85% is the national average. It is not the optimal occupancy for your facility.
Optimal Occupancy Varies by Facility Type
A 6-bed memory care facility maximizes profit above 92%. A 30-bed general assisted living community often peaks between 78% and 83%. Setting 85% as a universal target ignores the economics specific to your facility type.
Occupancy Is a Lagging Indicator
This month’s 85% reflects decisions made 6 to 12 months ago. As a steering wheel for operational decisions, occupancy responds too slowly.
Chasing Occupancy Backfires
Operators fill empty beds with residents whose acuity or behavioral patterns they should have declined. The downstream result: higher staff turnover, more family complaints, and lower occupancy 6 to 12 months later. The cycle repeats.
Metric 1: RevPAB (Revenue Per Available Bed)
Total revenue divided by total beds—occupied or not.
Why RevPAB Matters More Than Occupancy
A facility at 80% occupancy with RevPAB 25% above the industry average is structurally stronger over the long term than a facility at 92% occupancy with average RevPAB.
M&A buyers use RevPAB to determine whether a facility has pricing power.
Metric 2: Average Length of Stay
If your residents stay less than 18 months on average, the occupancy figure is deceiving you.
The Hidden Cost of High Turnover
Facilities with high resident turnover are perpetually selling. Marketing costs swell, staff onboard new residents instead of caring for existing ones, and quality of care slips. None of this shows up in the occupancy number.
How I Built a 28-Month Average
At my third facility, I built the operation around length of stay from year one. Annual new-admission volume now runs at less than half of comparable facilities. That feeds directly into our staff retention (roughly 3% annual turnover) and margin structure.
Metric 3: Family Referral Rate
The percentage of new admissions that came from existing-resident families or former-resident families.
The 30% Threshold
Above 30%, you can run with almost zero paid advertising. Below 10% indicates a structural problem in service quality.
When families choose a facility, the source they trust most is a recommendation from another family. This is the most defensible competitive advantage in senior care—and the hardest to manufacture.
Metric 4: Average Staff Tenure
Industry CNA turnover runs above 40%—average tenure of 12 to 15 months. If your facility holds above 24 months, you have a stronger operation than occupancy suggests.
Why M&A Buyers Weight Staff Tenure Heavily
In M&A valuation, staff tenure often weighs more heavily than occupancy. What buyers fear most is the scenario where staff exit en masse the moment ownership changes hands.
Occupancy Follows—It Does Not Lead
Track RevPAB, average length of stay, family referral rate, and staff tenure every month. Spend your management time on improving these four.
Occupancy follows as a downstream result. The reverse sequence does not work.
Try This Next Month
If your monthly operations meeting currently opens with occupancy, invert the agenda. Lead with family referral rate and staff tenure. Run that for three months, and the quality of decision-making in your facility will visibly shift.
About the author
Koujirou Nagata
I’m a Japanese care facility operator based in Kobe, Japan. Over 17 years, I built three small-scale residential care homes in the U.S., sold two of them for $2.7M in a 2022 M&A exit, and currently operate a third. My staff turnover has held at roughly 3% — against a U.S. industry average of 34.53% — and the majority of my admissions have come through family referrals rather than paid marketing.
I now help U.S. and ASEAN operators of small-scale residential care homes — board and care homes, adult family homes, and similar facilities — apply the same operating methods to their own launches and expansions. The resources I’ve built reflect what I actually use, not what looks good on paper.
More at smallcarefacility.com
Two ways forward
Take what you need from here.
If you’re starting
The Care Facility Starter Kit
Six free guides I use myself in the operation of small-scale care facilities — financial planning, property evaluation, the first 90 seconds of family tours, and referral partner outreach. The materials I share with operators who reach out to me directly.
Get the Starter Kit — Free6 PDFs · Pay what you want · Instant download
If you’re past the basics
Complete USA + ASEAN Care Business Bundle
Six in-depth operator guides covering USA market entry, state selection across 9 states, the full financial model, staff hiring & retention, and ASEAN market entry — plus 16 working Excel templates I use myself: hiring scorecard, financial simulator, 1-on-1 tracker, retention analytics, and more.
View the Complete Bundle — $1676 guides + 16 Excel templates · One-time purchase · Instant download
Koujirou Nagata · 17 years operating small-scale care facilities · 3 facilities built · $2.7M M&A exit · Currently operating
— Koujirou Nagata
17 years operating small-scale care facilities · 3 facilities built · $2.7M M&A exit · Currently operating